Views
PennyWallet has three views. The Finance Overview can be opened from the ribbon icon; the other two views are accessible from the header buttons inside Finance Overview, or via the Command Palette.
Finance Overview
The main dashboard. Open it by clicking the PennyWallet icon in the left ribbon, or run PennyWallet: Open Finance Overview from the Command Palette.
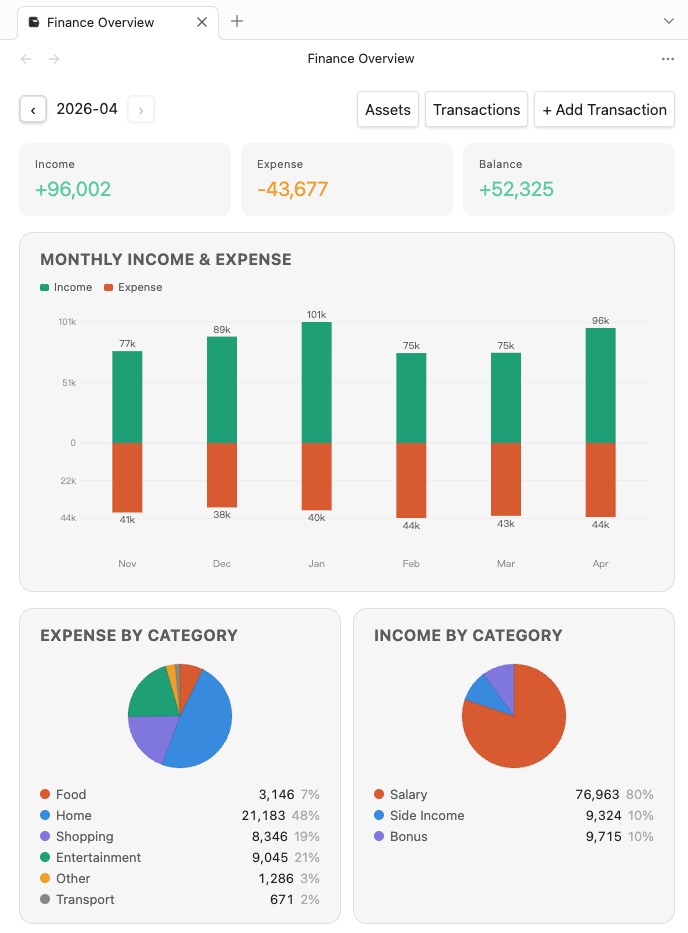
The header also contains two navigation buttons:
- Transactions — switch to the Transactions list view
- Assets — switch to the assets view
- + Add Transaction — open the transaction form
Month Navigation
Use ‹ / › to move between months. Future months are disabled.
Summary Metrics
| Metric | Description |
|---|---|
| Income | Total income recorded this month |
| Expense | Total expenses recorded this month |
| Balance | Income minus Expense for this month |
Account Balances
Shows the current running balance of every active account, calculated from all transactions since the initial balance was set — not just the current month.
Credit card balances are shown as negative values (outstanding debt).
Net Assets at the bottom is the sum of all cash/bank balances minus all credit card debt.
Asset Allocation Pie
Appears when you have two or more active cash/bank accounts with positive balances. Shows how your liquid assets are distributed across accounts. Each legend entry shows the account name, balance amount, and percentage.
Category Pie Charts
Two pie charts appear if there is data:
- Expense by Category — breakdown of this month's spending
- Income by Category — breakdown of this month's income
Each legend entry shows the category name, amount, and percentage. Small categories are grouped into Others; select that slice to drill into the grouped items. Hover over a slice or legend item to highlight it.
Transactions
A full list of all transactions for the selected month, with filters and subtotals.
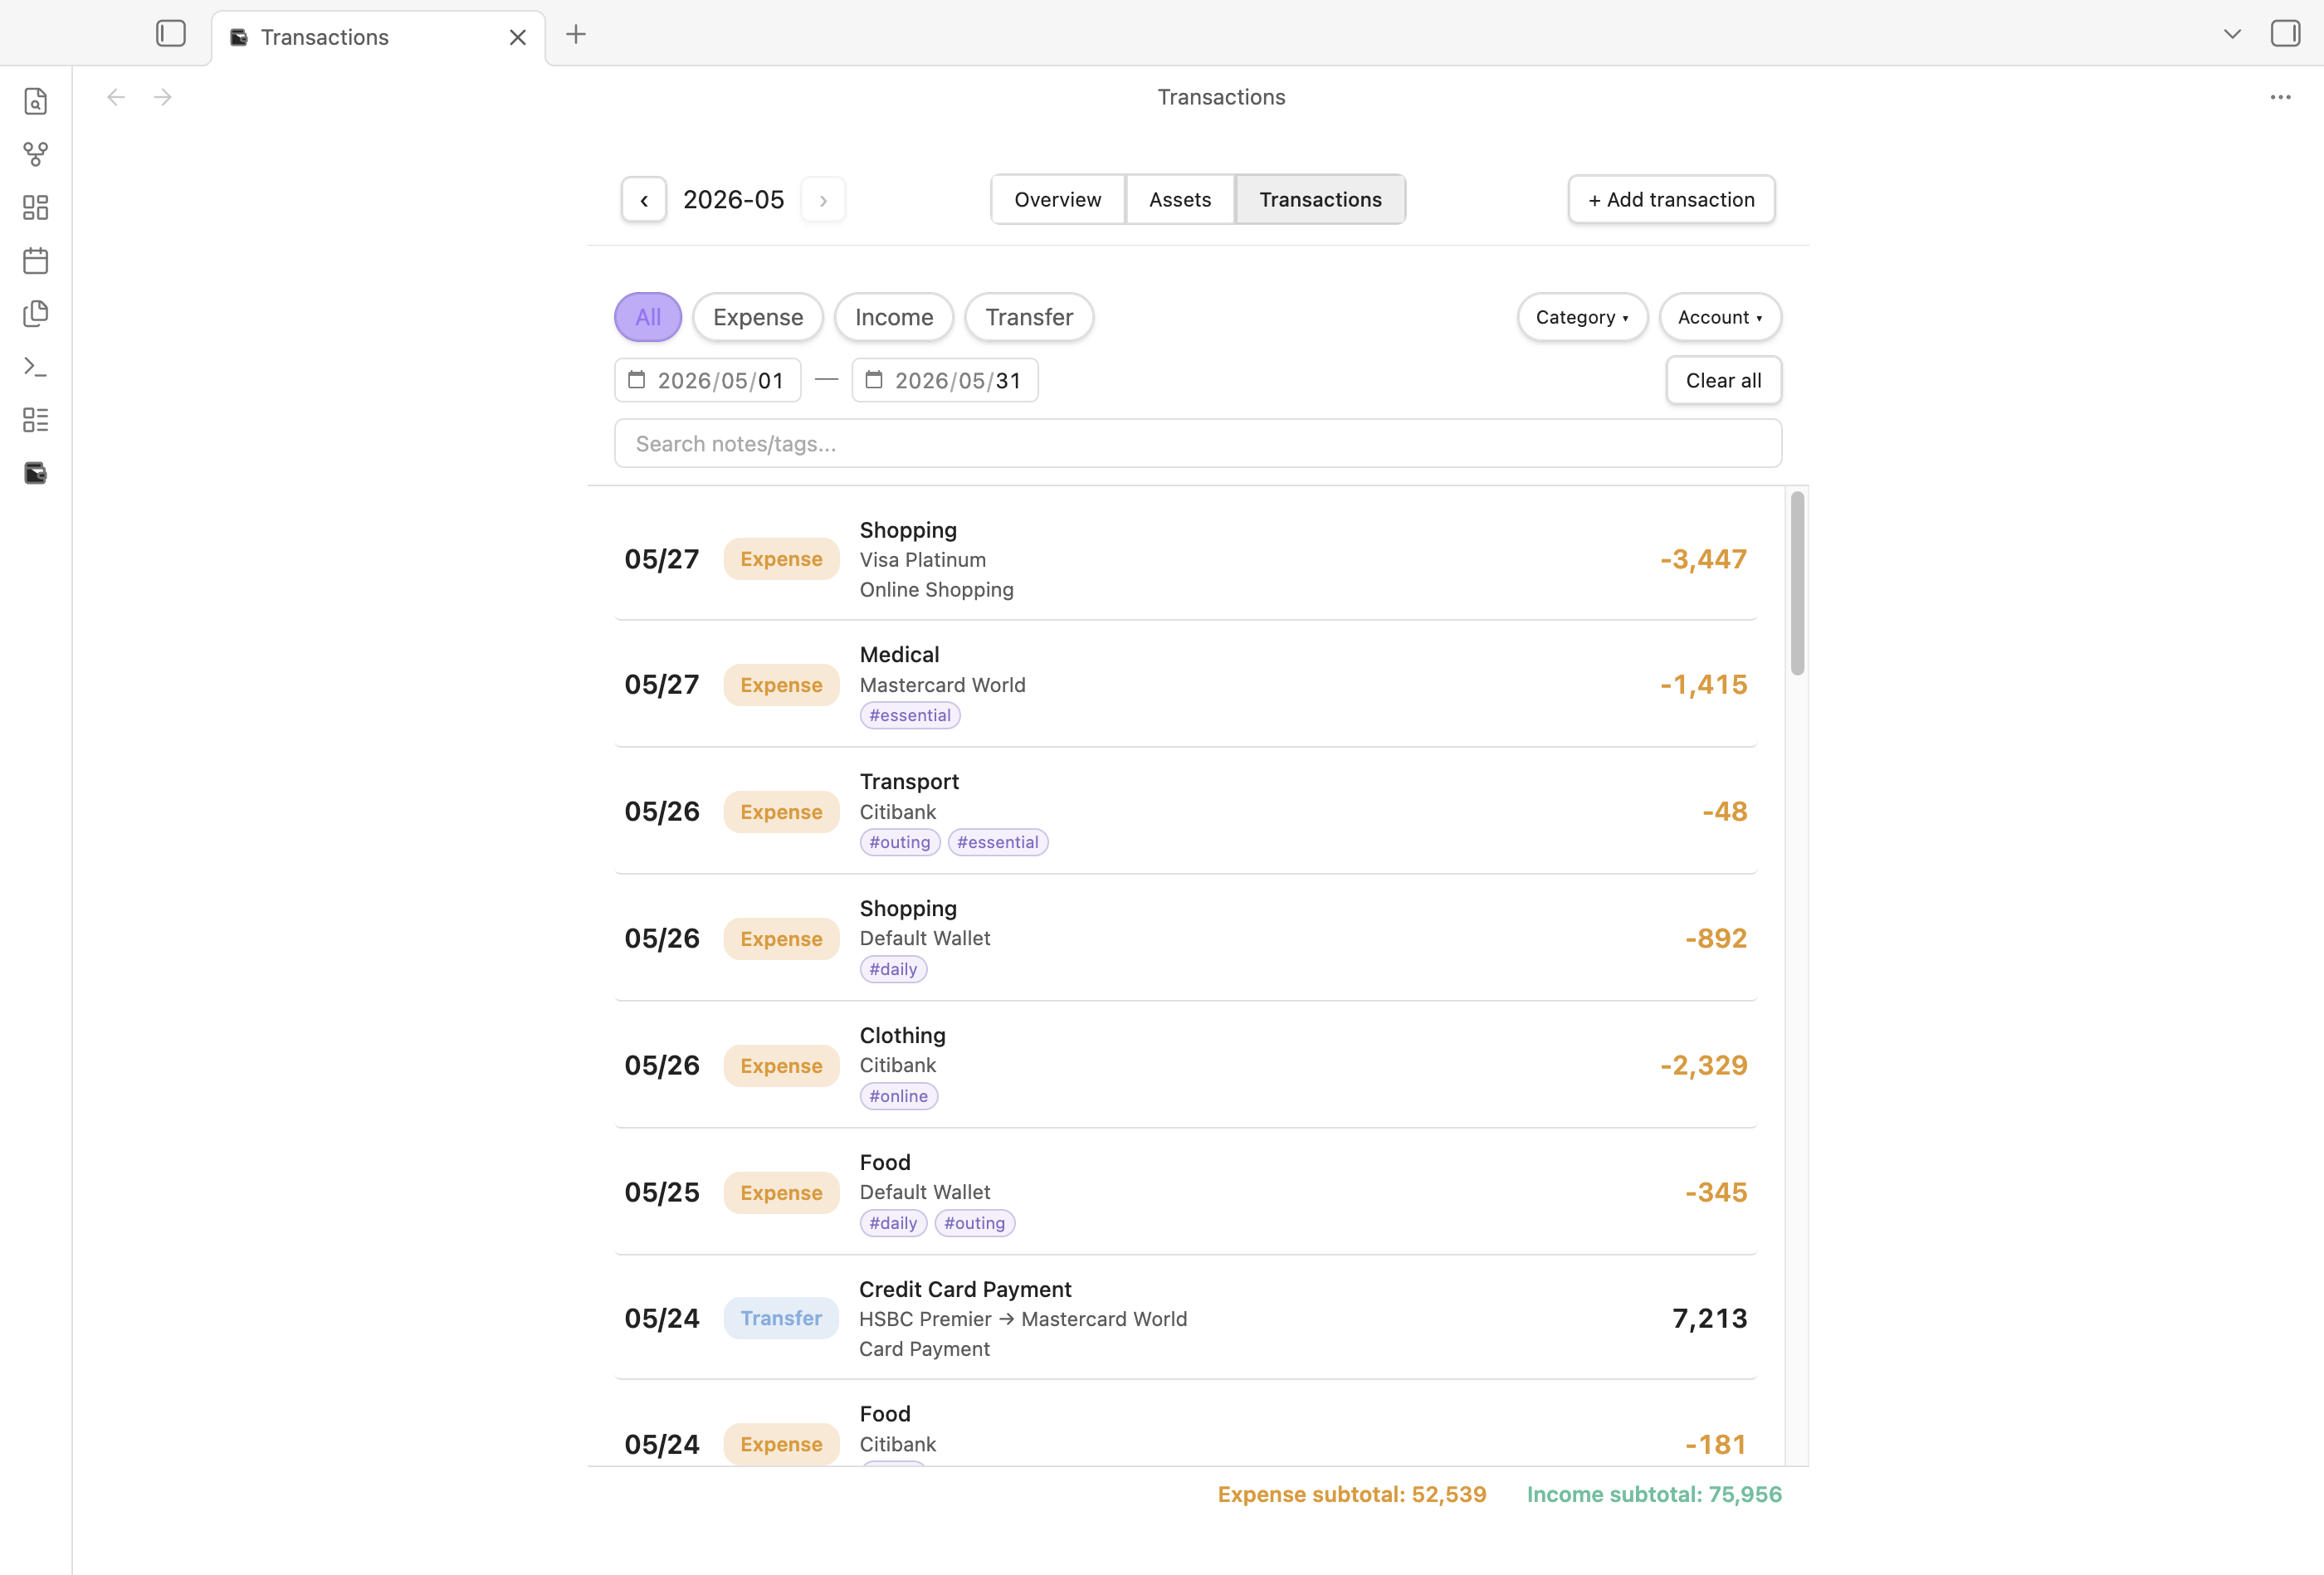
Filters
- Type pills — multi-select: All / Expense / Income / Transfer (tap multiple to combine)
- Wallet pills — multi-select; pills are tinted per account so the active filter is visible at a glance
- Category dropdown — checklist of categories present in the filtered results; select any combination to narrow further
- Keyword search — filters transactions whose note contains the search text
- Filter sheet (detail view) — a shared header opens a sheet for picking account and date range; on mobile, the sheet backdrop covers the Obsidian toolbar so the sheet owns the screen
Transaction Rows
Each row shows: date, type badge, category, note, account (or From → To for transfers), and amount.
On desktop, hover a row to reveal the ✏ edit action. On mobile, the edit affordance stays visible. Delete now lives inside the edit modal (a confirmation dialog appears before deletion). Refund expenses appear as positive expense reversals, visually distinct from income.
Subtotals
A fixed bar at the bottom always shows Expense Subtotal and Income Subtotal for the currently filtered transactions. The list scrolls independently without affecting the header or subtotals.
Assets
An assets-focused view for medium-term financial tracking. Open it from the Assets button in the Finance Overview header, or run PennyWallet: Open assets from the Command Palette.
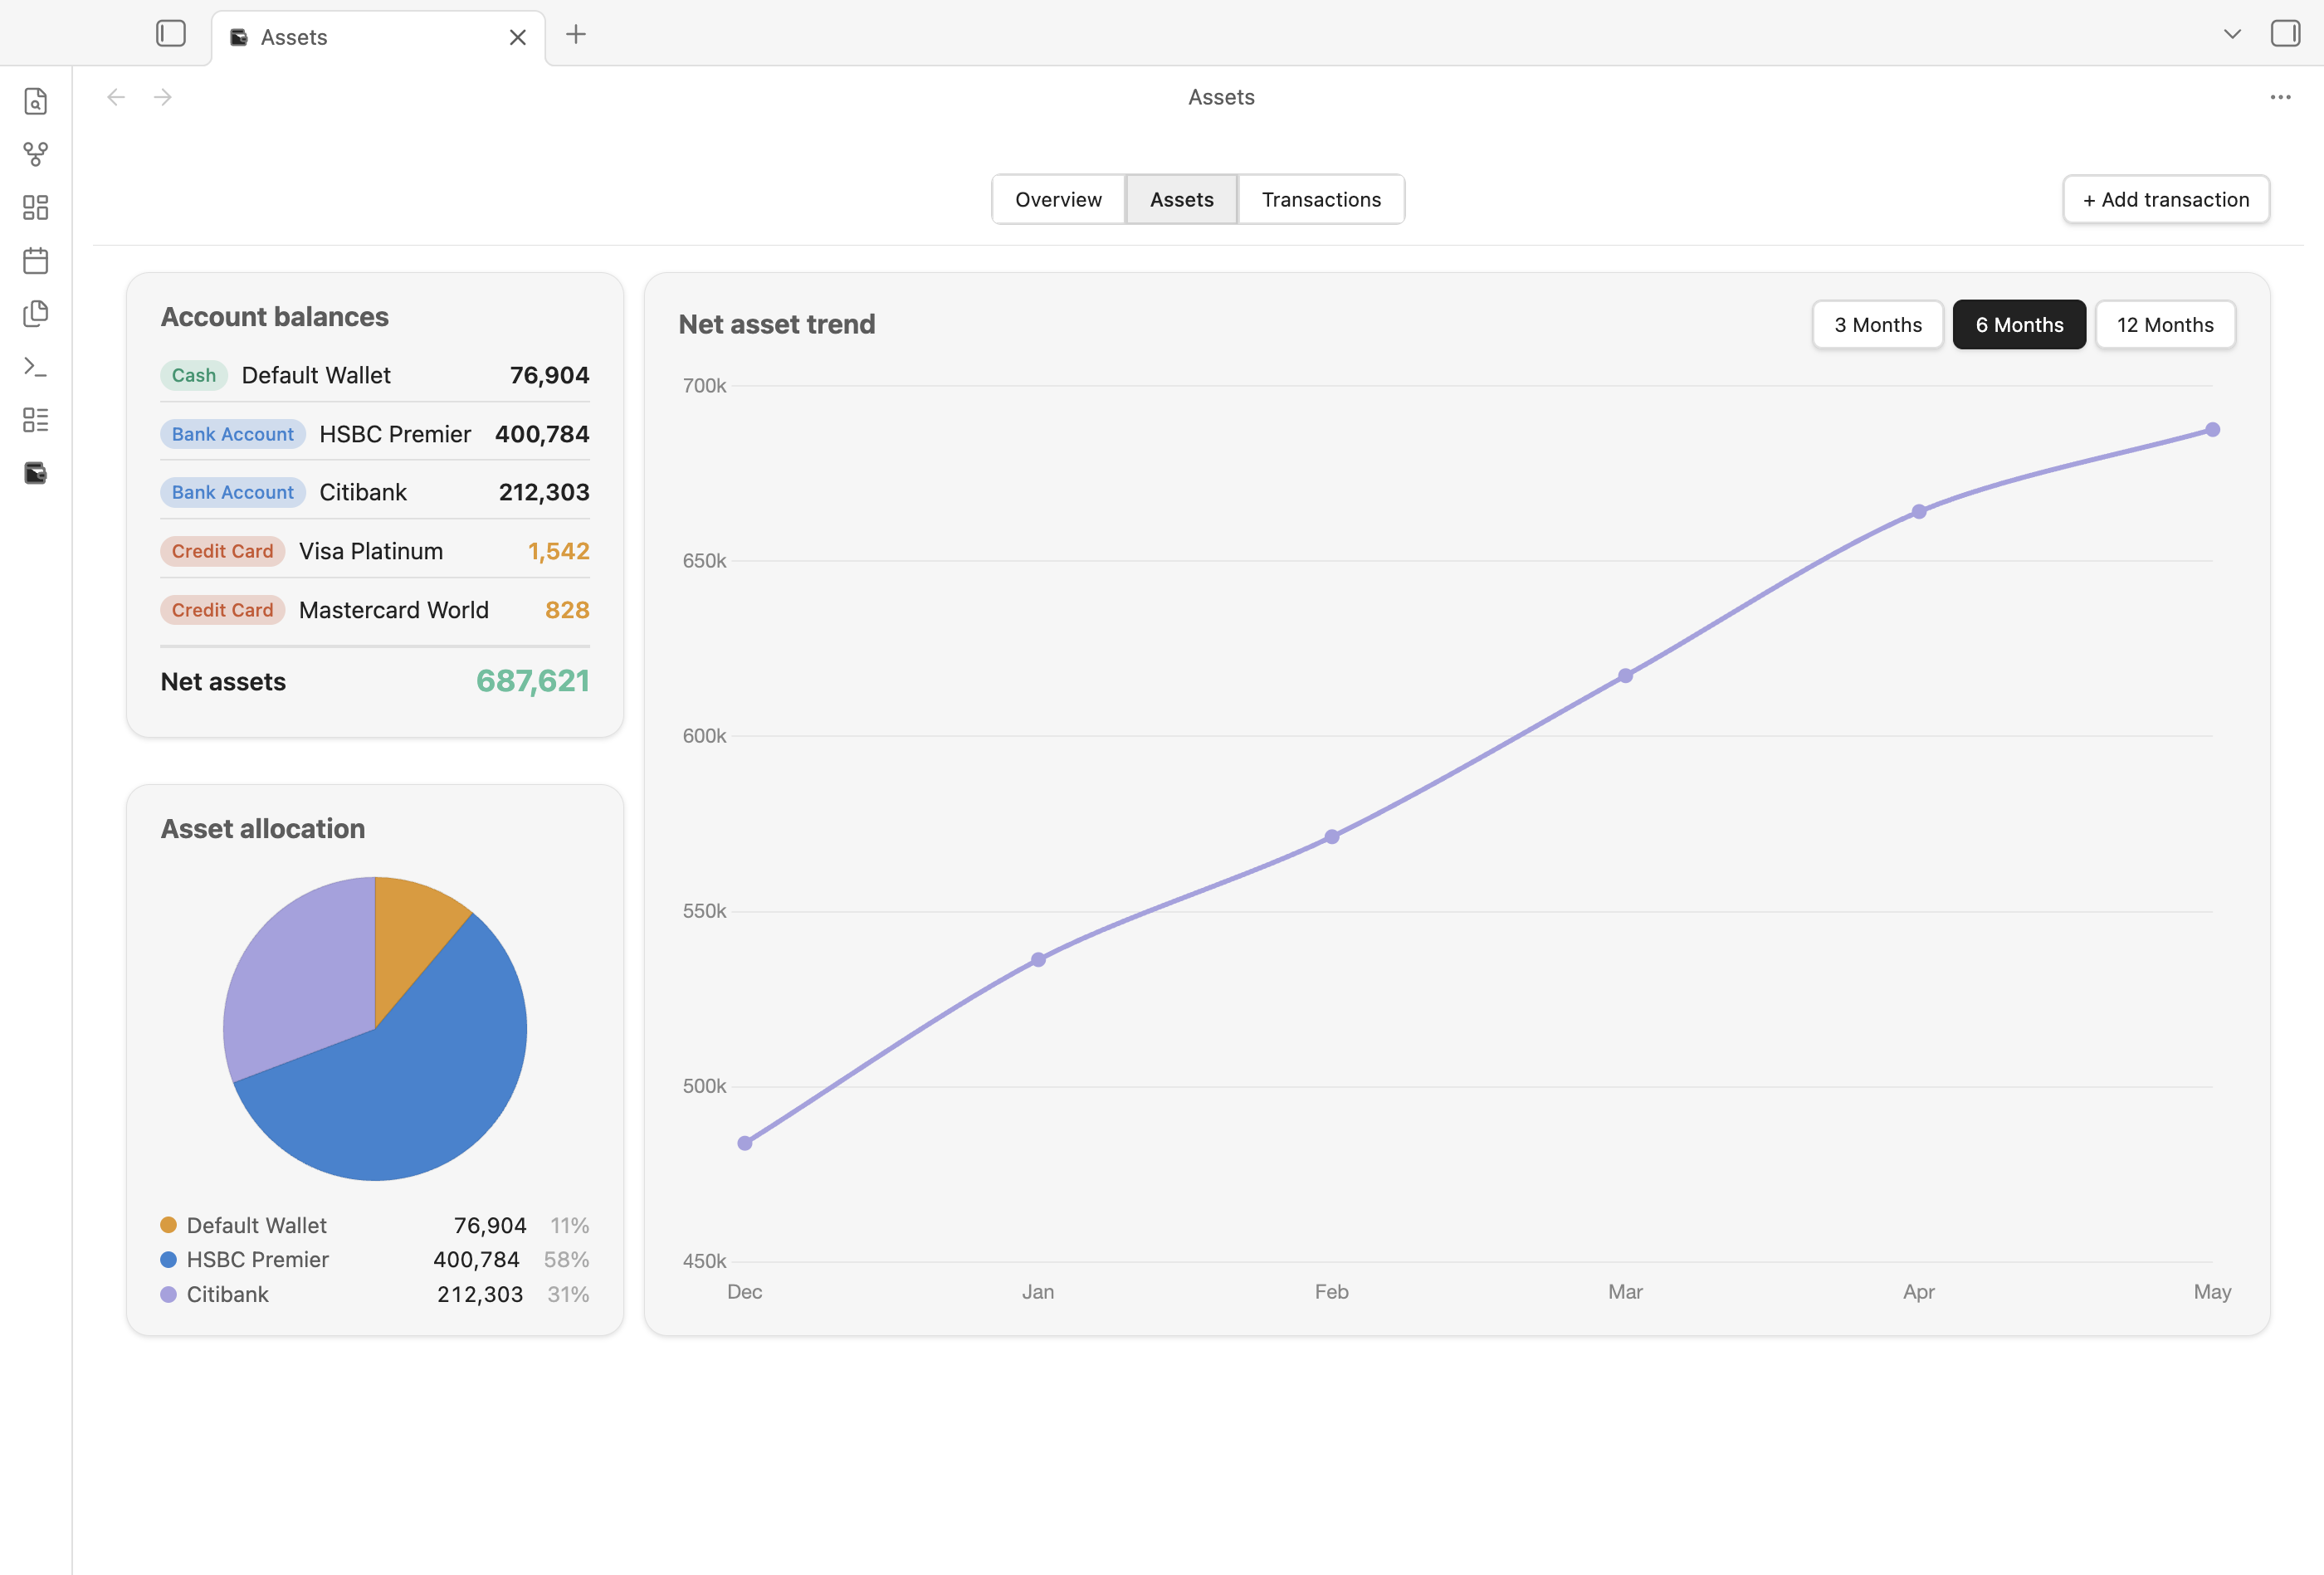
Range Selector
Choose 3 months, 6 months, or 12 months.
Account Balances
Shows the current running balance for each active account. Credit card balances are shown as negative values.
Net Assets at the bottom is the sum of all cash/bank balances minus all credit card debt.
Cashflow Metrics
| Metric | Description |
|---|---|
| Income | Total income within the selected range |
| Expense | Total expense within the selected range |
| Balance | Income minus Expense within the selected range |
| Savings Rate | Balance / Income (shown as 0% when income is 0) |
Net Asset Trend Chart
A line chart showing your net asset over the selected range. Hover near a data point to see the value. Missing months (no data) create a gap in the line.
Asset Allocation Pie
Appears when you have two or more active cash/bank accounts with positive balances. Shows the distribution of liquid assets across those accounts.